- Sessions
- London | 3:00 AM – 12:00 PM EST
- New York | 8:00 AM – 5:00 PM EST
- Technical analysis – The study of momentum, volume, and trends. Studying a stock’s past price movement on a chart to make assumptions about future price movement. In theory, the shorter the time frame, the more accurate the predictions are likely to be.
- Trend – The direction in which the stock price is moving.
- Time frames – Short time period (minutes or hours), or long time periods (weekly or monthly).
- Volume – Shows how many shares changed hands during a given time period (usually one day).
- Trading Candlesticks
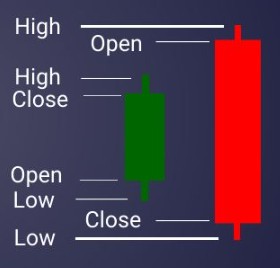
- One candle = one period of time and indicates who is in control.
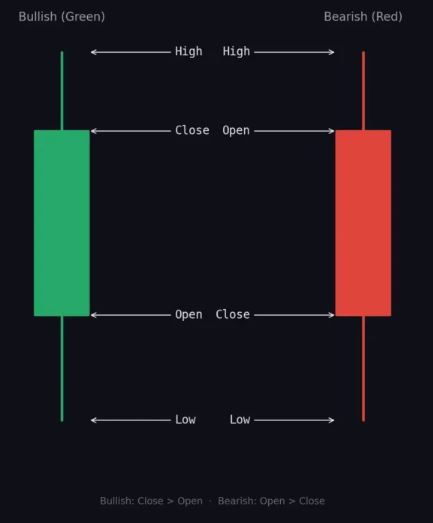
- The two components of the candlestick are the wicks and body.
- Where price opened, where price closed, the high, and low.
- Where price opened, where price closed, the high, and low.
- The body indicates direction and the wick indicates rejection. A large body indicates a strong move. A long wick indicates price tried to move and got pushed back.
- The two components of the candlestick are the wicks and body.
- Pattern 01 – Hammer
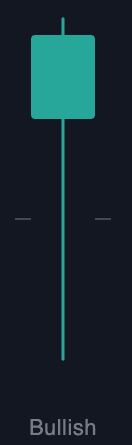
- Small body at the top with a long low wick. Price dropped hard, then buyers stepped in and pushed it back up. This is a bullish reversal signal. Look for it at the bottom of a downtrend.
- Small body at the top with a long low wick. Price dropped hard, then buyers stepped in and pushed it back up. This is a bullish reversal signal. Look for it at the bottom of a downtrend.
- Pattern 02 – Shooting Star
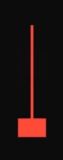
- Small body at the bottom with a long upper wick. Price spiked up, then sellers slammed it back down. This is a bearish reversal signal. Look for it at the top of an uptrend.
- Small body at the bottom with a long upper wick. Price spiked up, then sellers slammed it back down. This is a bearish reversal signal. Look for it at the top of an uptrend.
- Pattern 03 – Bullish Engulfing
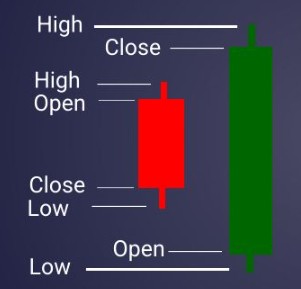
- A small red candle followed by a big green candle that completely engulfs it. Buyers took over hard. A bullish reversal is a strong signal at the end of a downtrend.
- A small red candle followed by a big green candle that completely engulfs it. Buyers took over hard. A bullish reversal is a strong signal at the end of a downtrend.
- Pattern 04 – Bearish Engulfing
- A small green candle followed by a big red one that completely engulfs it. Sellers took over hard. A bearish reversal is a strong signal at the end of an uptrend.
- A small green candle followed by a big red one that completely engulfs it. Sellers took over hard. A bearish reversal is a strong signal at the end of an uptrend.
- Pattern 05 – Doji
- Open and close are basically the same. Wicks on both sides. Neither side won the period. The market is undecided. A doji candle indicates indecision and it is strongest when it appears after a long trend.

- Open and close are basically the same. Wicks on both sides. Neither side won the period. The market is undecided. A doji candle indicates indecision and it is strongest when it appears after a long trend.
- One candle = one period of time and indicates who is in control.
The Mind of a Day Trader
Technical Analysis
Copyright © 2026, Market Scholar. Proudly powered by WordPress. Blackoot design by Iceable Themes.